


Vax Lotteries Disappoint
No discernable effect
Beginning with Ohio Gov. Mike DeWine’s May 12 announcement, fourteen states, two U.S. territories and a growing number of metropolitan governments have adopted lotteries as incentives to COVID-19 vaccinations.
As an enthusiastic advocate of such programs, going back decades, I’ve pestered a lot of people in a lot of places to try something like this. Now, after crawling through a minefield of bad data … I don’t see any proof of efficacy!
Ohio reported a remarkable rise in vaccination statistics in the week after the Vax-a-Million kick-off. It might have been statistical cherry-picking. It might have been just a blip in a time series. And it might not even be a real blip, but merely a artifact of time-shifting in the statistical supply chain.
In any case, this alleged surge (anywhere from 28% to 53%) seems to be the sole basis for claims of efficacy on which many more jurisdictions pinned their hopes and a share of their COVID mad money.
Not ready to give it up, but we don’t know what went wrong — and that is part of what’s wrong. Even the Wright Brothers first flight had instruments1 on board, but everybody testing this untested concept was satisfied flying blind and not looking back.
And if anybody is doing a serious after-the-fact analysis, I haven’t heard about it. So here we go.
A word about the data
And that word is “bad”. COVID vaccination statistics are bad in most ways data can be bad. Gathered inconsistently from time to time, place to place, source to source and reporting chain to reporting chain, with omissions and duplications, loss and lack of detail, in the face of varying global trends, intervening events, changes in availability, policy, eligibility and the public information environment.
CDC tries to capture and publish counts of shots administered each day. Actual shots vary by day of the week within larger trends, and may be perturbed by supply chain issues, holiday schedules, good and bad publicity, arena-scale vaccination events, etc. Reported shots, however, vary with — and may be dominated by — lags and bursts in the progress of individual reports through multi-stage chains of reporting entities (which vary both by jurisdiction and subpopulation) whose policies and protocols change from time to time, as does adherence to same.
And a note on methodology
Public response to vaccination efforts varies with income, ethnicity, political orientation, and population density. This makes direct state-to-state comparisons difficult.
Reasoning that county-level reporting might be more consistent than state aggregates, and that neighboring counties across state lines might share common demographics and media market influences, I spent some effort and lost some time looking for county-to-county comparables.
At length I settled on the following approach:
Work with first-shot totals for age 18 and over — a daily series the CDC publishes from Feb 13 onward. The big-money lotteries are directed almost exclusively2 to this age range, and primarily3 designed to move unvaccinated subjects to get their first shot.
Compute week-over-week increases in these counts on a daily basis, to remove day-of-week variation and mitigate reporting delays.
Express these figures as percentages of the target group4, i.e., the remaining unvaccinated population in the same age range.
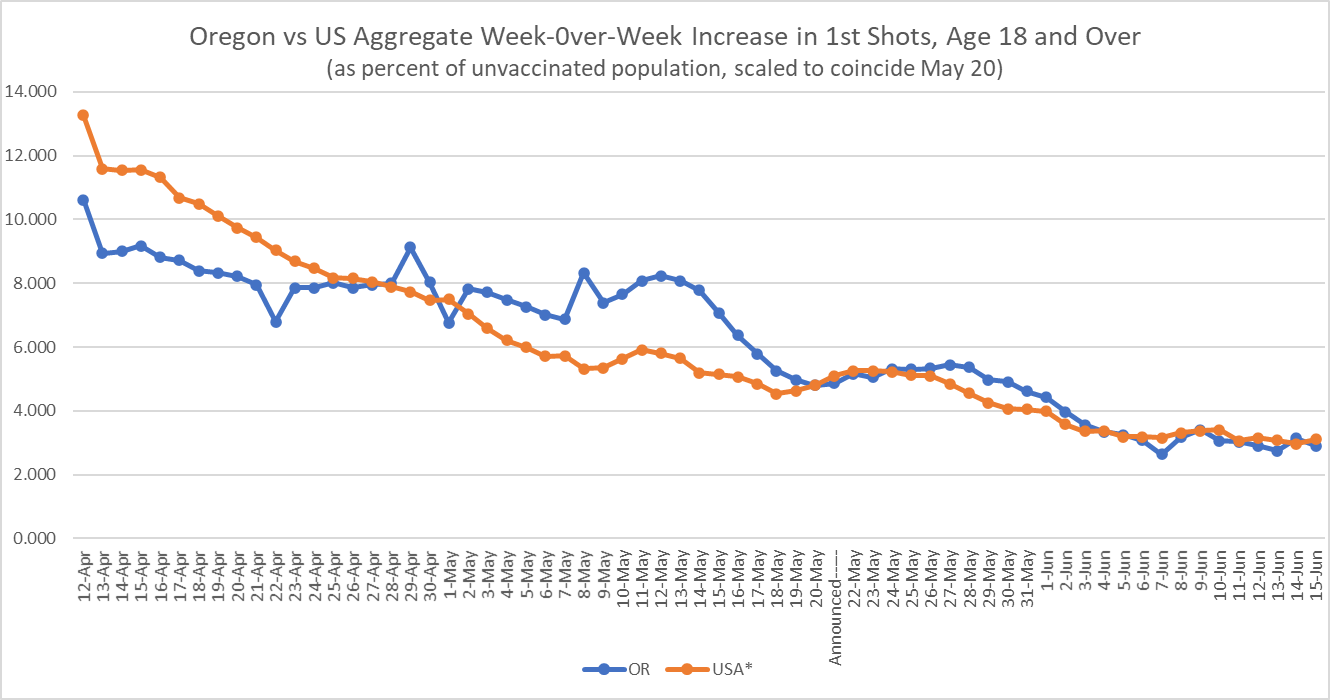
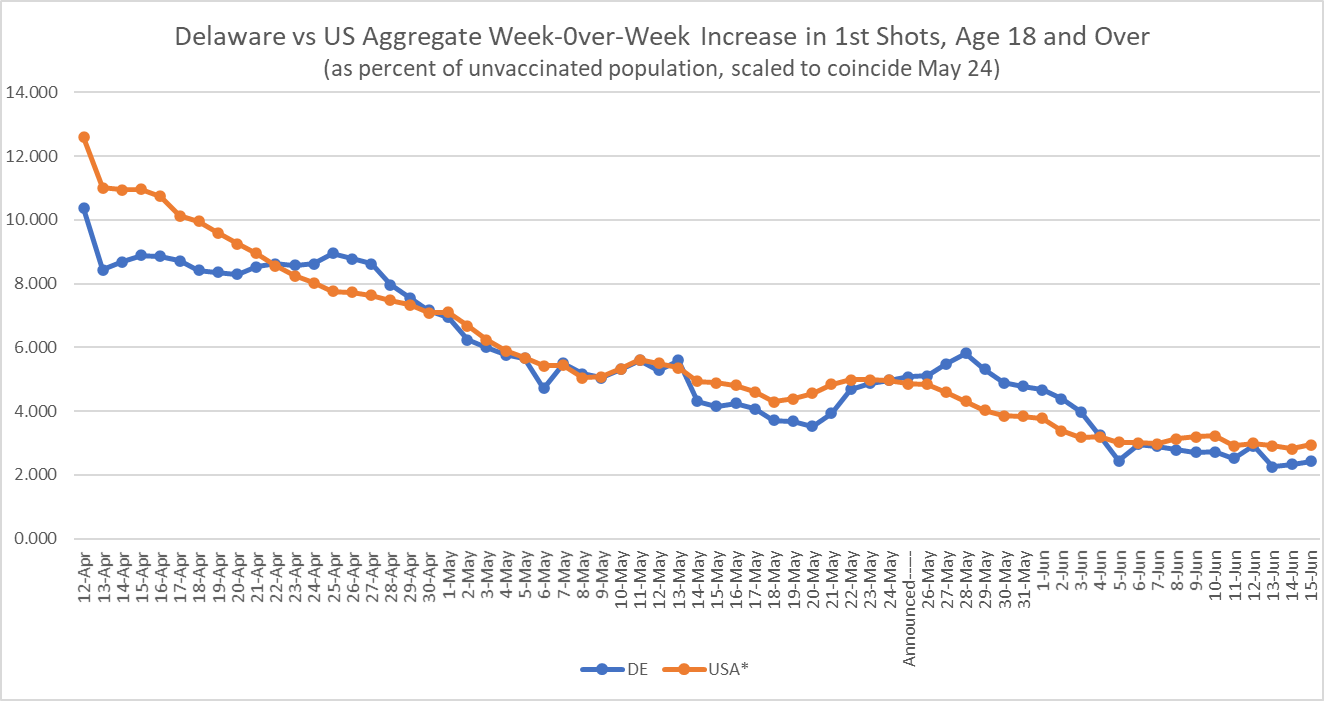
Present these as time series for each of the lottery states, plotted against the same series for the USA as a whole5.
Finally, scale the USA aggregate to coincide with the lottery state result the day before the lottery was announced, making any divergence from that point forward visually apparent.
Let’s begin with Ohio.

And for comparison, try New Mexico.

As much as we might discern a smidgen of post-announcement over-performance in Ohio’s blue line, we’d find under-performance in New Mexico (even with their $5M grand prize). Keep looking.
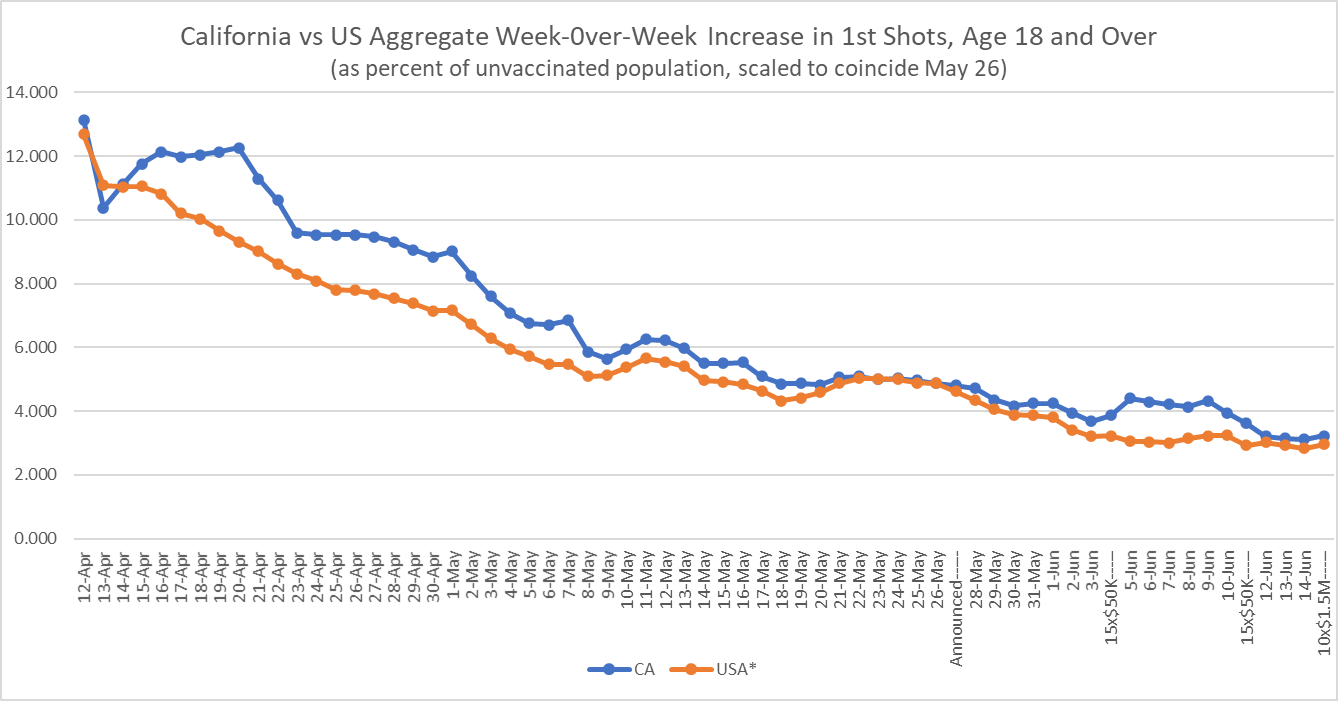
That looks sorta good, if you don’t look too close and notice CA has been above trend 55 of the last 60 days.

Nothing to shout about there.
Or there.

Or there.
Could be good … or could just be the usual swing.

Nothing.

And nothing there.
Ohio may be the best of the lot, and as I suggested earlier it might look worse under a forensic microscope.
All in all, a negative result in something I’ve always felt very positive about. A fact-checker’s heartbreaker.
An anemometer, a stopwatch, engine revolution recorder.
Californians age 12-17 could win, but can’t receive winnings until age 18.
California Pfizer and Moderna recipients can win with one shot, but must complete both before they receive the money. MA residents must be fully vaccinated before they can even enter the drawing.
A case could be made for adjusting our “target population” to exclude the most determined vaccine-hesitant share.
Considering the high correlation of vaccination hesitancy to political orientation, a case could be made for excluding red states from the US aggregate. With the exception of West Virginia, the lottery states are blue or purple states.